
TL;DR
Key Takeaways:
- Replace vanity metrics with revenue-focused measurement that connects every campaign to actual profit
- Choose between composable (for $2M+ spend) or all-in-one systems based on your resources and technical capability
- Implement the 12-week transformation starting with revenue analysis, not tool selection
- Expect 5-10x efficiency improvements by focusing on incrementality testing and AI-powered optimization
The $10 Million Question Your Data Can’t Answer
Picture your last board meeting.
Your CMO shows beautiful charts: traffic up 47%, 10,000 new leads, engagement through the roof. The CEO asks one simple question: “Which part of our $10 million marketing budget actually made us money?”
Awkward silence.
You’re not alone. Despite spending millions on marketing technology, only 22% of companies can connect their marketing efforts to actual revenue. The rest? They’re drowning in dashboards while thirsting for answers.
But here’s what’s changing: The winners in 2025 aren’t the ones with the most data. They’re the ones who turned their data systems into profit engines.
This playbook shows you how.

Why Traditional Marketing Data Failed You
Let’s be honest about why your current system isn’t working.
The Vanity Metrics Trap
Here’s what keeps CMOs awake at night: They’re celebrating metrics that don’t matter while the ones that do stay hidden.
Your dashboard shows 50,000 website visitors this month. Impressive, right? Except 15,000 of them are bots, and most of the real humans bounced after three seconds. Email open rates hit 25%—a new record!—but those opens didn’t translate to a single sale. Social media posts rack up thousands of likes from people who’ll never buy anything.
The real story lives in the shadows. Which campaigns actually bring in customers who stick around and spend money year after year? What does it truly cost to acquire someone who becomes a loyal, profitable customer? These answers remain buried in disconnected spreadsheets while teams celebrate vanity metrics that sound impressive in board meetings but contribute nothing to the bottom line.
The Tool Explosion Problem
Want to know why your marketing feels chaotic? The average company uses 91 different marketing tools. Ninety-one! Each vendor promised their platform would be “the solution” to all your problems. Instead, you’ve created a digital monster that eats time and spits out confusion.
Picture this familiar scene: Your Monday morning meeting begins with three different numbers for the same metric. Your CRM reports 10,000 leads, your email platform shows 12,500, and Google Analytics insists the real number is 8,300. Nobody knows which system to trust. Your marketing manager spends six hours every week just trying to make the numbers match across platforms.
The cruel irony? Despite drowning in data from dozens of tools, you still can’t answer the one question that matters: What actually drives revenue? You’ve got more dashboards than a NASA control room but less clarity than when you started.

The Attribution Fairy Tale
Here’s the dirty secret: Traditional attribution is like giving credit for a touchdown to whoever touched the ball last. It ignores the entire team effort that got you to the end zone.
Your customer didn’t buy because of that last Facebook ad. They bought after 27 different touchpoints over 6 months. But your attribution model? It’s still playing “pin the credit on the channel.”
The Three Revolutions Changing Everything
Revolution 1: The Composable Awakening
Remember when you had to buy an entire Office suite just to use Excel? Marketing platforms worked the same way—until now.
Remember when you had to buy Microsoft Office just to use Excel? You paid for Word, PowerPoint, and a dozen other programs you never touched. Marketing platforms worked the same way—massive, expensive systems where you’d use 10% of the features and pay for 100%.
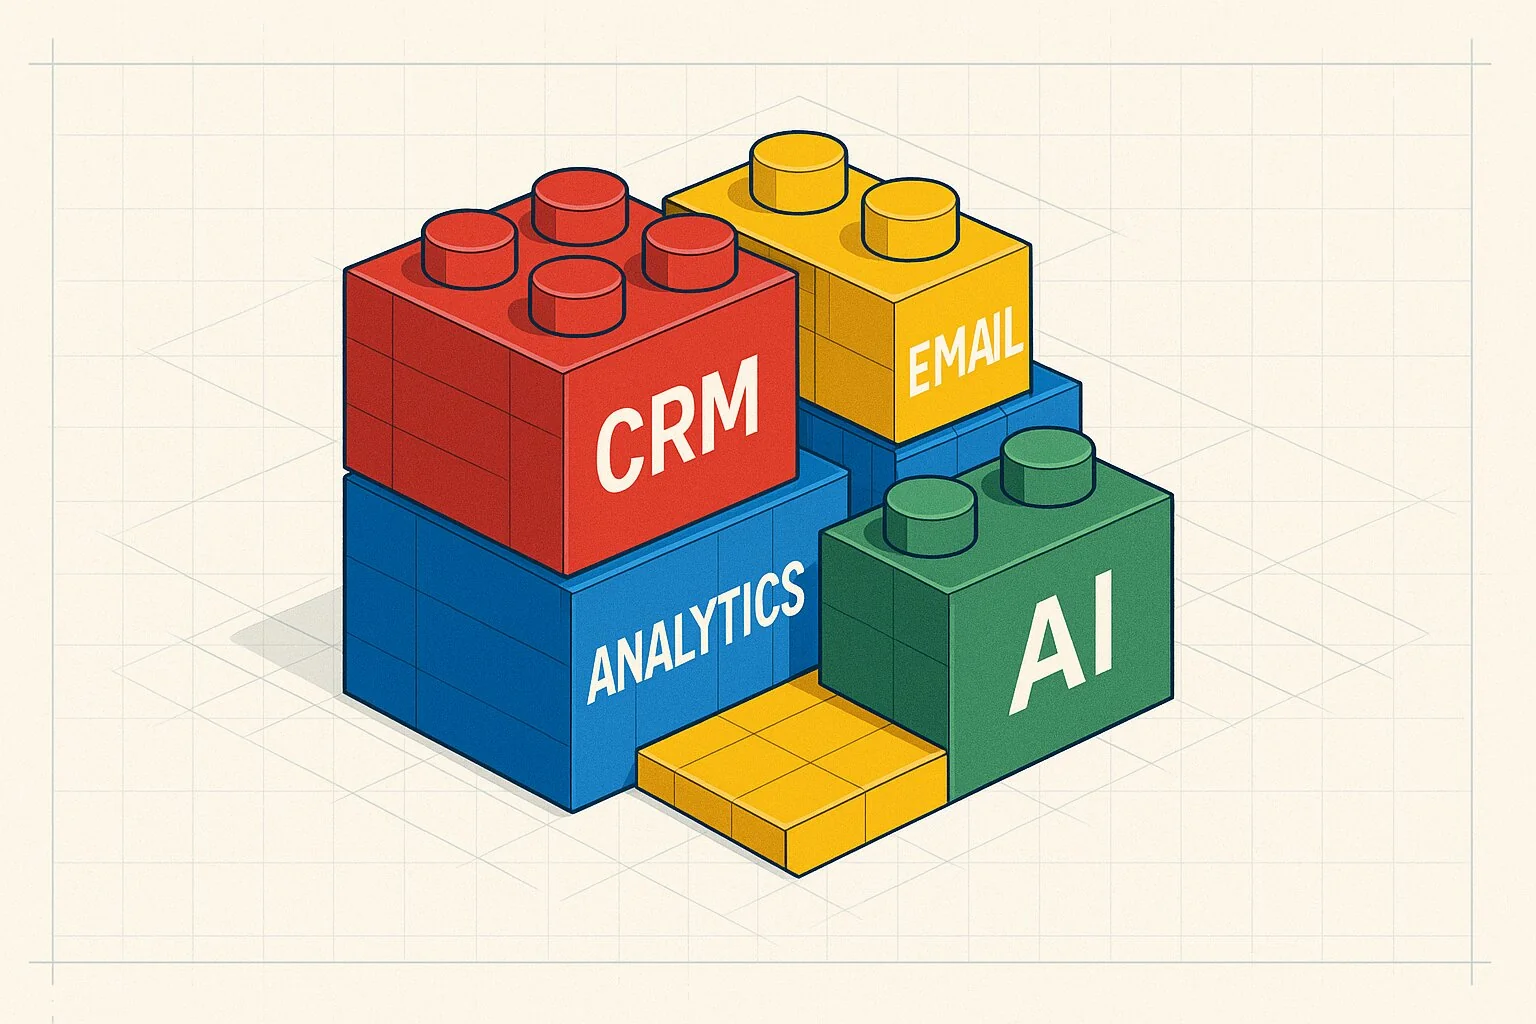
The revolution changes everything. Now you can build exactly what you need using modular pieces that snap together like LEGO blocks. Need customer data management? Add that piece. Want predictive analytics? Snap it in. Require automated email personalization? Click it into place.
But here’s the critical question: Is composable right for you?
Choose Composable If You:
- Have $2M+ annual marketing spend
- Need custom integrations across 10+ tools
- Have technical resources to manage complexity
- Require specific compliance (healthcare, finance)
Stick With All-In-One If You:
- Have <$500K annual marketing spend
- Want simple setup and maintenance
- Lack dedicated technical resources
- Need to get results in 30-60 days
This shift is massive—the customer data platform market exploded from $2 billion to $7.4 billion because companies are tired of paying for unused features. But bigger isn’t always better—choose the approach that matches your resources and timeline.
Revolution 2: The Cookie Crumbles (Finally)
Google keeps delaying the death of third-party cookies (now late 2025), but smart companies stopped waiting. They’re building for a future where you can’t track people across the internet like digital stalkers.
The winners use a three-layer approach that creates unshakeable competitive advantages. Big picture modeling helps you see the forest instead of getting lost in individual trees, revealing how all your marketing efforts work together to drive growth. Incrementality testing measures true impact by showing what wouldn’t have happened without your campaigns, not just what coincidentally occurred afterward. AI-powered insights find patterns that humans miss entirely, connecting dots across millions of data points to reveal opportunities hiding in plain sight.
One Fortune 500 CMO put it perfectly: “We stopped asking ‘who gets credit?’ and started asking ‘what actually works?’ Our ROI went from 2.3x to 8.7x in 18 months.”
Revolution 3: AI That Actually Helps (With Concrete Steps)
AI isn’t just buzzword—it’s fundamentally changing how data systems work. But vendors won’t tell you: AI without clean data is expensive gambling.
Phase 1: Basic AI Implementation (Weeks 1-4)
- Lead scoring based on behavioral patterns
- Automated audience segmentation
- Simple prediction models for customer lifetime value
- Email send time optimization
Phase 2: Intermediate AI (Months 2-3)
- Churn prediction with 70%+ accuracy
- Dynamic pricing based on demand patterns
- Content personalization at scale
- Campaign budget auto-optimization
Phase 3: Advanced AI (Months 4-6)
- Multi-touch attribution modeling
- Predictive customer journey mapping
- Real-time bid adjustments
- Automated A/B test design and analysis
Reality Check: Start with one AI use case, measure results for 30 days, then expand. Most companies try to implement everything at once and end up with nothing working properly.
The Modern Approach: Less Tracking, More Profit
Start With Money, Not Metrics
Traditional approach: Track everything, hope something matters
Profitable approach: Start with revenue, work backwards
Every piece of data should answer one question: “How does this help us make money?” If it doesn’t, delete it.
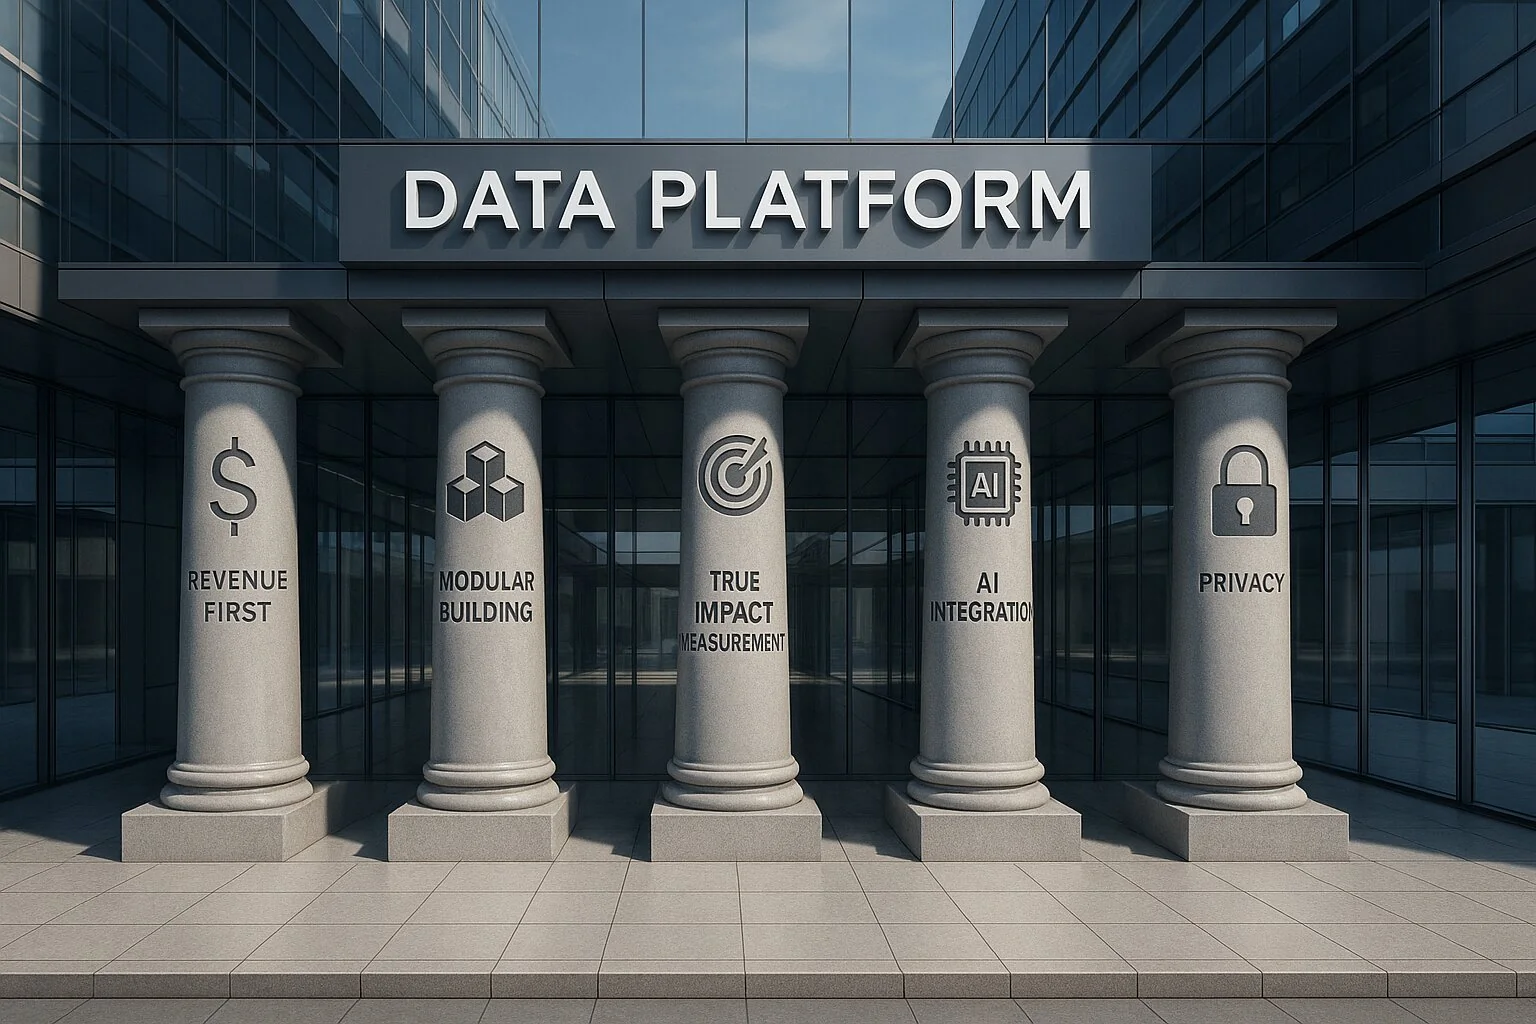
The Five Pillars of Profitable Systems
1. Revenue First
Stop tracking vanity metrics. Every dashboard, every report, every analysis must connect to dollars.
2. Modular Building
Build with pieces you can change. Markets move fast—your tech stack should too.
3. True Impact Measurement
Don’t just track what happened. Measure what wouldn’t have happened without you.
4. AI From the Start
Don’t add AI later. Build it into every data flow from day one.
5. Privacy as a Feature
With fines exceeding €2.5 billion, privacy isn’t optional. Make it your competitive advantage.
Decision Framework: Choose Your Path
If Annual Marketing Spend < $200K:
- Start with Google Analytics 4 + basic CRM integration
- Focus on email automation and simple attribution
- Timeline: 2-4 weeks, Investment: <$1,000/month
If Annual Marketing Spend $200K-$2M:
- Add customer data platform (HubSpot, Klaviyo)
- Implement basic AI for lead scoring and segmentation
- Timeline: 2-3 months, Investment: $2,000-8,000/month
If Annual Marketing Spend $2M+:
- Build composable stack with data warehouse
- Advanced attribution and incrementality testing
- Timeline: 4-6 months, Investment: $15,000-50,000/month
Your 12-Week Transformation
Weeks 1-4: Dig for Gold in Your Data
Time needed: 15-20 hours per week
Week 1: The Revenue Reality Check
Pull 18 months of data and prepare for surprises:
- 40% of your “attributed” revenue would have happened anyway
- Your “best” channels often have the worst real returns
- Customer value varies 300% based on how you acquired them
Week 2: Choose Your Foundation
Selecting the right data warehouse becomes your single source of truth for all marketing decisions. Snowflake delivers unmatched performance for large-scale operations, handling petabytes of data with automatic scaling that grows with your business. BigQuery integrates seamlessly if you’re already invested in Google’s ecosystem, offering incredible query speeds and built-in machine learning capabilities. Databricks excels for AI-heavy approaches, providing unified analytics and machine learning in one platform.
Getting Your Hands Dirty: Technical Setup Made Simple
Don’t worry—you don’t need a computer science degree to get this running. Here’s how to set up your foundation step by step.
If You Choose Snowflake (Great for Companies with Lots of Data): Snowflake works like a super-powered Excel that can handle millions of rows without breaking a sweat. Your technical team will create a dedicated space for marketing data and set up tables that track what really matters: which campaigns generated revenue and what each customer is worth over time.
If You Choose BigQuery (Perfect if You Already Use Google Tools): Google’s BigQuery integrates seamlessly with everything else in the Google ecosystem. Think of it as Google Sheets' big brother—one that can crunch massive amounts of data in seconds. Your team will set up dedicated datasets for marketing analytics and create tables that connect customer touchpoints to actual revenue.
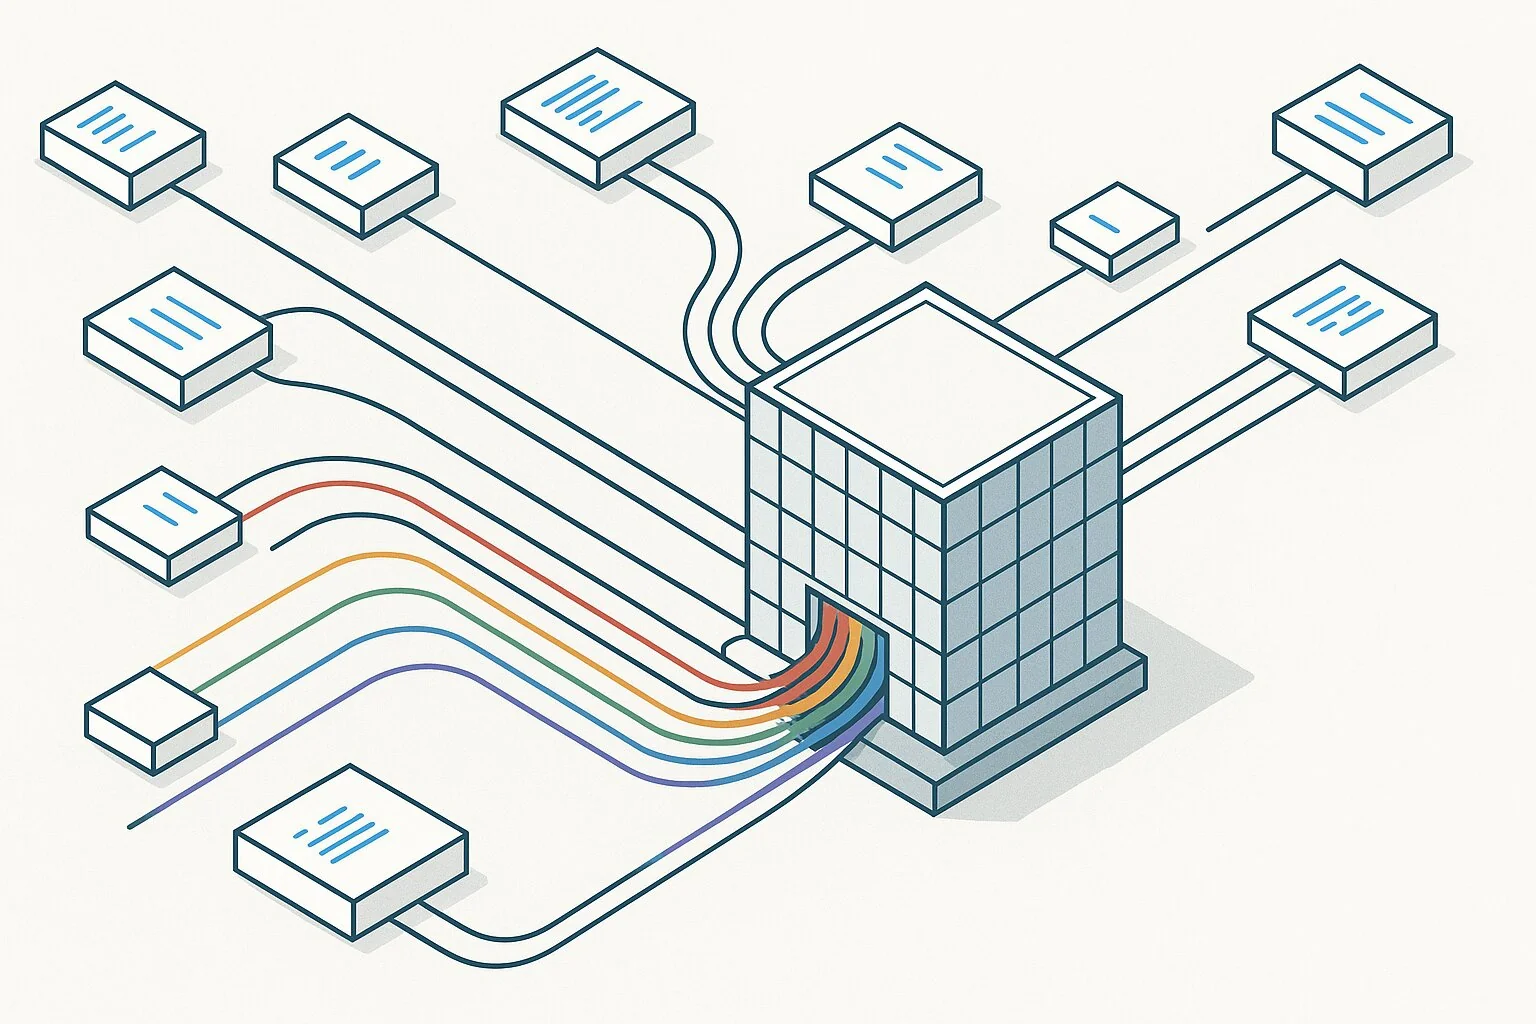
The key insight? Both platforms organize your scattered marketing data into one place where you can finally see the complete customer journey from first click to final purchase.
Week 3: Go Composable
Think of building your composable stack like assembling a high-performance team where every player has a specific role but works perfectly with the others.
Census acts like your data quarterback, taking enriched customer information from your warehouse and delivering it precisely where your marketing tools need it. No more late nights trying to sync customer lists between platforms or wondering why your email tool shows different numbers than your CRM.
Hightouch becomes your marketing team’s best friend with its visual, drag-and-drop interface. Non-technical team members can create sophisticated audience segments and automated workflows without bothering the IT department for every small change. Marketing managers love this because they can test new strategies quickly instead of waiting weeks for technical implementation.
MessageGears solves the security puzzle that keeps compliance teams awake at night. Instead of copying sensitive customer data across multiple platforms (creating security vulnerabilities), it reads directly from your database to personalize experiences in real-time. Financial services and healthcare companies especially value this approach because it maintains strict data security while enabling sophisticated personalization.
The Human Side: Getting Team Buy-In
Week 1: Stakeholder Alignment
- Map who needs what data for decisions
- Identify power users vs. data skeptics
- Create “What’s In It For Me” messaging per department
- Address fears about job displacement
Week 2-3: Change Management
- Start with willing early adopters
- Create quick wins that demonstrate value
- Document success stories for broader rollout
- Establish data literacy training programs
Week 4: Process Integration
- Update job descriptions to include data responsibilities
- Modify meeting agendas to include data reviews
- Create data-driven decision templates
- Establish feedback loops for continuous improvement
Week 4: Fix Identity Tracking
With third-party cookies disappearing, sophisticated identity resolution becomes your competitive moat. Email and phone matching provides the foundation, but true identity mastery goes far deeper. Behavioral pattern recognition analyzes how customers browse, click, and engage across sessions, creating unique fingerprints that persist beyond cookie deletion. Relationship mapping reveals network effects by understanding who knows whom, enabling you to identify high-value prospects through their connections to existing customers.
Skills and Resources You Actually Need
Technical Skills Required:
- SQL basics (can be learned in 2-4 weeks)
- Understanding of APIs and data flows
- Basic statistical concepts (correlation, significance)
- Project management for complex implementations
Team Structure for Success:
- Data Analyst (1 FTE): Builds reports, manages dashboards
- Marketing Technologist (0.5 FTE): Handles tool integrations
- Data Engineer (0.25 FTE): Maintains data pipelines
- Change Management Lead (0.25 FTE): Drives adoption
Budget for Learning:
- Training and certification: $5,000-15,000 annually
- External consultants for setup: $10,000-25,000 one-time
- Ongoing support and optimization: $3,000-8,000 monthly
Weeks 5-8: Build Your Intelligence Layer
Time needed: 20-25 hours per week
Week 5-6: Start Testing What Really Works
Incrementality testing reveals the holy grail of marketing: what actually drives extra revenue versus what simply coincides with sales. Geographic holdout tests provide the cleanest methodology, running campaigns in carefully selected test markets while holding back identical control markets. The key lies in ensuring statistical power with at least 80% confidence and proper randomization to eliminate selection bias.
The Science Behind Reliable Results
Here’s where marketing becomes more like medicine—you need proper experiments to know what actually works.
Think of incrementality testing like a clinical trial for your marketing. Just as drug companies can’t just give everyone a new medication and hope for the best, you can’t just run campaigns everywhere and assume they’re working. You need control groups—markets where you deliberately don’t run campaigns—to see what would have happened anyway.
The math behind this isn’t as scary as it looks. Essentially, you’re calculating how many customers you need in your test to be confident your results aren’t just random luck. For most businesses, testing 15,000 people in each group (test and control) gives you reliable answers about whether a campaign truly drives extra sales or just coincides with normal business growth.
This might sound complicated, but modern tools handle the heavy statistical lifting. You focus on the strategy while the software ensures your results are statistically sound.
Real Examples Across Company Sizes
Startup Example ($50K Marketing Budget) Local fitness app with 2-person marketing team:
- Used Google Analytics 4 + simple CRM integration
- Focused on email automation and basic attribution
- Achieved 40% improvement in customer acquisition cost
- Investment: $500/month, 10 hours/week implementation
Mid-Market B2C Example ($500K Marketing Budget) E-commerce fashion brand with 8-person team:
- Implemented Shopify Plus + customer data platform
- Added predictive analytics for inventory and marketing
- Increased repeat purchase rate by 60%
- Investment: $8,000/month, 3-month implementation
Enterprise B2B Example ($5M Marketing Budget) SaaS company with 25-person marketing team:
- Built composable stack with data warehouse
- Advanced attribution and incrementality testing
- Reduced cost per acquisition by 35% while scaling
- Investment: $45,000/month, 6-month implementation
Week 7: Move Beyond Last-Click
Traditional last-click attribution creates a distorted view of your marketing reality, giving 100% credit to the final touchpoint while ignoring the journey that brought customers to that moment. Modern attribution models distribute credit across all touchpoints based on their actual influence on purchase decisions.
Machine learning algorithms analyze millions of customer journeys to identify patterns that humans miss, revealing which combinations of touchpoints drive the highest conversion rates and customer lifetime value. These algorithms continuously learn and adapt as customer behavior evolves, keeping your attribution model accurate over time.
Making Attribution Actually Useful
Here’s where things get interesting. Instead of giving all credit to the last click before a purchase, modern attribution spreads credit across the entire customer journey based on what actually influenced the decision.
Imagine a customer who first discovers your brand through a Facebook ad, researches you via Google search, reads your email newsletter for three months, then finally buys after clicking a retargeting ad. Traditional attribution gives 100% credit to that final retargeting ad. But that’s like giving the goalkeeper all the credit for a soccer goal.
Advanced attribution uses machine learning to analyze thousands of similar customer journeys and determine how much each touchpoint actually contributed to the final purchase. Maybe that initial Facebook ad deserves 30% credit for creating awareness, Google search gets 25% for capturing intent, email nurturing earns 35% for building trust, and the final retargeting ad receives just 10% for closing the deal.
The technical implementation analyzes patterns across millions of customer interactions—which channels work best in combination, what timing produces optimal results, and how different content types influence purchasing behavior. The system continuously learns and adapts as customer behavior evolves, keeping your attribution model accurate over time.
This isn’t just academic exercise. Companies using sophisticated attribution models typically discover their “best” channels by traditional metrics actually perform worst when you account for their true incremental impact.
Week 8: Predict the Future
Use your data to see what’s coming:
- Which customers will buy again
- When demand will spike
- Where to invest next quarter’s budget
Weeks 9-12: Make It Work in Real Life
Time needed: 25-30 hours per week
Week 9-10: Connect Everything
Make your insights actionable:
- Push scores back to your CRM
- Update ad platforms with better audiences
- Trigger personalized experiences automatically
Week 11: Build for Privacy
Create tracking that respects users:
- Server-side tracking (more accurate, more private)
- First-party data focus (what customers tell you directly)
- Hashed identifiers (anonymous but consistent)
Week 12: Launch Your Command Center
Build dashboards executives actually use:
- Five metrics max per dashboard
- Revenue impact always visible
- Mobile-friendly (CEOs check phones)
- Actions, not just observations
Your First 30 Days
Day 1-10: The Reality Check
Start by understanding where you really are:
- List every marketing tool you’re paying for
- Calculate how much revenue you can actually track
- Find where data lives in silos
- Document what decisions you can’t make today
Day 11-20: Quick Wins
Fix the basics that deliver immediate value:
- Connect your CRM to analytics (finally)
- Add revenue values to conversion tracking
- Start one incrementality test
- Kill three reports nobody reads
Day 21-30: Build Momentum
Set the foundation for transformation:
- Choose your data warehouse
- Select one composable tool to start
- Create your first revenue-focused dashboard
- Make one data-driven decision that saves money
Five Expensive Mistakes to Avoid
Mistake 1: Waiting for Perfect Data
The perfectionist’s trap catches countless marketing teams who believe they need pristine data before starting any transformation. Perfect data doesn’t exist in the real world, where customers behave unpredictably and systems inevitably have gaps. Starting with 80% accuracy and improving iteratively delivers results months or years ahead of teams waiting for impossible perfection.
Mistake 2: Buying All the Tools
Every vendor promises their platform will solve all your problems, leading to tool collection instead of strategic thinking. More tools create exponentially more complexity, not better insights. Master one composable tool completely before adding another, building expertise that compounds rather than fragmenting your team’s knowledge.
Mistake 3: Ignoring Privacy
Many teams treat privacy compliance as a future problem, not realizing that one violation can cost millions in fines and lost customer trust. European companies face fines up to 4% of global revenue, while US privacy laws expand rapidly. Building privacy protections from day one costs far less than retrofitting compliance later.
Mistake 4: Tracking Everything
The “more data is better” philosophy drowns teams in noise while obscuring actual insights. Every additional metric you track increases complexity exponentially while decreasing clarity. Focus ruthlessly on tracking only data that drives specific decisions, eliminating vanity metrics that consume resources without delivering value.
Mistake 5: Going It Alone
Teams often waste months solving problems that others have already conquered, believing they can figure everything out independently. Learning from others' expensive mistakes accelerates your timeline and avoids predictable pitfalls. Invest in expert guidance and peer learning instead of expensive trial-and-error cycles.
Three Real Success Stories: Different Sizes, Same Principles
Story 1: Local Service Business ($100K Annual Revenue)
The Company: Regional HVAC company with 3-person marketing team
The Challenge: Couldn’t track which ads led to actual service calls
The Solution: Call tracking + simple CRM integration + Google Analytics
The Investment: $300/month tools + 20 hours setup
The Results: 45% improvement in cost per lead, $50K additional annual revenue
Story 2: E-commerce Brand ($2M Annual Revenue)
The Company: Direct-to-consumer skincare brand
The Challenge: High customer acquisition costs, low repeat rates
The Solution: Customer data platform + predictive analytics + email automation
The Investment: $3,000/month + 2 months implementation
The Results: 60% increase in customer lifetime value, 25% reduction in acquisition costs
Story 3: B2B SaaS ($50M Annual Revenue)
The Company: Enterprise software with complex sales cycles
The Challenge: 37 dashboards, zero revenue attribution
The Solution: Full composable stack + incrementality testing
The Investment: $35,000/month + 4 months implementation
The Results: Cut marketing spend 23%, increased revenue 31%, saved 120 hours monthly
The Universal Lesson: Success comes from connecting marketing activities to business outcomes, regardless of company size or complexity.
Your Investment and Timeline
Phase 1: Foundation (Months 1-3)
Investment: $8,000-18,000/month
This phase feels like renovating your kitchen—messy and expensive upfront, but you’ll wonder how you lived without it. Your biggest costs come from data warehouse setup ($2,000-5,000 monthly) and the tools that move customer information between systems ($1,500-3,000 monthly).
Don’t skip the consulting budget ($2,000-4,000). Yes, it feels expensive, but avoiding rookie mistakes saves months of frustration and tens of thousands in wasted licensing costs. Think of consultants as insurance against expensive trial-and-error cycles.
What You’ll Actually See: Marketing efficiency improves 2-3x as you stop wasting money on campaigns that don’t work and double down on the ones that drive real growth. Most companies recover their Phase 1 investment within 90 days through reduced advertising waste alone.
Phase 2: Intelligence (Months 4-6)
Investment: $15,000-32,000/month
This is where things get exciting. You’re not just measuring what happened—you’re predicting what will happen and automatically optimizing campaigns in real-time.
Machine learning platforms ($4,000-8,000 monthly) analyze millions of customer interactions to predict who’s most likely to buy, what they’ll purchase, and when they’ll make that decision. Incrementality testing tools ($3,000-6,000) finally answer the question every CEO asks: “Which marketing actually drives extra sales?”
You’ll need specialized talent here—data scientists and marketing analysts who understand both statistics and business strategy ($6,000-12,000 monthly). This isn’t optional; AI without human expertise is just expensive randomness.
What Changes: Your marketing becomes predictive instead of reactive. You’ll know which prospects to prioritize, what messages resonate, and where to invest next quarter’s budget before your competitors even analyze last quarter’s results. Most companies see 5-7x efficiency gains as AI eliminates guesswork.
Phase 3: Scale (Months 7-12)
Investment: $25,000-55,000/month
This is where you build a marketing machine that runs itself. Advanced AI platforms ($8,000-15,000 monthly) make thousands of optimization decisions per day—adjusting bids, personalizing content, and shifting budgets between channels faster than any human team could manage.
You’ll need a dedicated team of specialists ($12,000-25,000 monthly) who think like engineers but understand marketing. These aren’t just analysts—they’re architects building systems that compound your marketing intelligence over time.
Enterprise licenses and advanced attribution modeling ($5,000-15,000 monthly) connect every customer touchpoint to revenue outcomes, revealing insights that would be impossible to discover manually.
The Transformation: Your marketing operates like a hedge fund’s trading algorithms—constantly learning, adapting, and optimizing based on real-time data. Companies at this stage typically achieve 10x+ efficiency improvements as their systems identify opportunities and execute optimizations 24/7. You’re not just competing with other marketing teams; you’re competing with machines.
Detailed Cost Breakdown by Tool Category
What This Actually Costs (No Hidden Surprises)
Let’s talk real numbers. Most vendors hide their pricing behind “contact us” forms, but here’s what you’ll actually pay:
Your Data Foundation: Snowflake starts around $500 monthly for smaller operations but can reach $5,000 as you scale. Think of it like cloud storage—you pay for what you use. BigQuery costs less upfront ($300-3,000) since Google charges per query rather than storage. Databricks sits in the middle ($800-6,000) but includes powerful AI tools that might eliminate other platform costs.
The Tools That Move Data Around: Census typically runs $1,200-4,000 monthly depending on how much customer data you’re syncing between systems. Hightouch costs slightly less ($1,000-3,500) but offers easier visual interfaces that non-technical team members can actually use. MessageGears commands premium pricing ($2,000-8,000) because it reads directly from your database without copying sensitive data—crucial for financial services or healthcare companies.
The Smart Stuff (AI and Advanced Analytics): DataRobot automates machine learning for $3,000-12,000 monthly—expensive but potentially worth it if you lack data science expertise. Palantir Foundry targets large enterprises ($8,000-25,000) with comprehensive AI capabilities. Many companies build custom solutions for $2,000-10,000 monthly, which offers more control but requires technical expertise.
The bottom line? Expect to invest $15,000-40,000 monthly for a complete system that actually delivers results, not just pretty dashboards.
The ROI Reality That Matters
Here’s what actually happens: Most companies see positive ROI within 90 days, not because the technology is magic, but because they finally stop wasting money on campaigns that don’t work.
The math is simple. If you’re spending $500,000 monthly on marketing and can only attribute 50% to actual results, you’re essentially gambling with $250,000 every month. Even modest improvements in attribution and optimization quickly pay for the entire system.
Full payback typically occurs within 6 months, but the real value compounds over time. Companies with mature systems don’t just recover their investment—they fundamentally change their competitive position. While competitors guess about customer behavior, you know. While they react to market changes, you predict them.
The key insight? Start with revenue focus, not technology fascination. The shiniest AI platform won’t help if you don’t know what questions to ask or how to act on the answers.
Your Next Action
The gap between companies with and without proper data systems is widening daily. While competitors debate dashboards, you could be building a machine that turns data into dollars.
Your Three-Step Reality Check (Do This Week)
First, calculate how much revenue you can actually trace back to specific marketing efforts today. Pull data from every channel—Google Ads, Facebook, email, content marketing, events—and match it to actual closed deals. Prepare for a shock: Most companies can only connect 40-60% of their revenue to specific marketing activities. That means nearly half your marketing impact is invisible.
Second, run a simple incrementality test on your biggest marketing channel. Pick 10-15 similar geographic markets and stop all campaigns in half of them for two weeks. This feels scary—like intentionally hurting your business—but it’s the only way to discover how much revenue that channel actually generates versus what would have happened anyway. You might find your “best” channel only drives 20% incremental sales.
Third, finally connect your CRM to your analytics platform. This single integration reveals which leads actually turn into customers and how much they’re worth over time. The results often flip everything you thought you knew about channel performance. Those expensive leads from LinkedIn might have 3x higher lifetime value than cheap traffic from Facebook, completely changing your budget allocation strategy.
These three actions will either confirm your marketing is working as expected or reveal opportunities to dramatically improve efficiency. Either way, you’ll make decisions based on reality instead of assumptions.
Here’s the thing about data systems: Perfect is the enemy of profitable. You don’t need pristine data or flawless attribution to start making better decisions. You just need to be slightly more accurate than you are today, then improve incrementally every week.
The gap between companies with modern data systems and those stuck in spreadsheet hell widens every quarter. While your competitors debate dashboard colors and argue about attribution models, you could be building a machine that turns data into actual dollars.
The playbook exists. The technology works. The only question remaining is whether you’ll build a system that generates impressive PowerPoints for board meetings or one that generates measurable profits for shareholders.
Your investors already know which one they prefer. The question is: What are you waiting for?
Remember: The best system is the one that gets implemented and used consistently. Start with your current resources, focus on connecting marketing to revenue, and build incrementally. Perfect attribution is less valuable than good decisions made quickly.
The companies winning in 2025 aren’t the ones with the most sophisticated technology—they’re the ones who turned their data into decisions and their decisions into dollars.
Quick Reference: Key Terms
Composable CDP: A modular data platform you build piece by piece (like LEGO for data)
Incrementality: The extra revenue your marketing actually created (not what would have happened anyway)
Marketing Mix Modeling (MMM): Statistical analysis showing how all your marketing works together
Reverse ETL: Pushing insights from your warehouse back to tools that take action
First-Party Data: Information customers give you directly (not tracked or bought)
Attribution: Giving credit where credit is due (harder than it sounds)
Get Help When You Need It
Free Resources That Accelerate Implementation:
Open-source marketing mix modeling tools like Meta’s Robyn provide enterprise-grade statistical analysis without licensing costs. These tools help you understand how all marketing channels work together to drive growth, revealing interaction effects that traditional attribution misses.
Data quality frameworks such as Great Expectations automate the tedious work of validating data integrity across your entire pipeline. These frameworks catch data issues before they corrupt your insights, saving countless hours of detective work later.
Community forums like Modern Data Stack Slack connect you with practitioners solving identical challenges. Real-world advice from peers who’ve implemented similar systems proves invaluable when vendor documentation falls short.
Expert Networks for Advanced Guidance:
The CDP Institute offers vendor-neutral guidance that cuts through marketing hype to focus on practical implementation strategies. Their research and best practice frameworks help you avoid common pitfalls that derail data transformation projects.
Incrementality.org provides battle-tested frameworks for measuring true marketing impact. Their methodologies help you design statistically sound experiments that deliver reliable insights about what actually drives growth.
RevOps Collective facilitates peer learning among revenue operations professionals who understand the practical challenges of aligning marketing, sales, and customer success data. Their shared experiences help you anticipate and solve integration challenges before they become roadblocks.
Remember: The best system is one that gets used. Start simple, focus on revenue, and build from there.
Need Help Implementing This Playbook?
Get expert guidance implementing this strategy for your specific business needs
Get Strategic Consultation